
The Great Divide: Navigating a Contested Market at the Crossroads of Complacency and Conviction; The Beyond Gamma Effect
Markets at a snapshot and Convexity on Gamma Math for those who enjoy that kind of thing


Executive Summary
The S&P 500 options market on October 28, 2025, presents a starkly bifurcated landscape, characterized by a fundamental schism between institutional risk mitigation and speculative retail fervor. While headline metrics like the Put/Call ratio suggest caution, a deeper, forensic analysis reveals that the aggressive, directional impetus is overwhelmingly bullish. The market is defined by a stable, passive, and cautious institutional underbelly being overrun by an aggressive, active, and speculative wave of upside participation. This dynamic is unfolding within a deeply suppressed volatility environment that is both a symptom of market complacency and a catalyst for the observed speculative behavior.
Key findings from this analysis indicate a market precariously balanced on the fulcrum of an imminent Federal Open Market Committee (FOMC) decision. The elevated put volume is predominantly defensive in nature, characterized by passive trade execution and a concentration in lower-delta strikes, consistent with systematic portfolio insurance rather than outright bearish speculation. In stark contrast, an anomalously high Call Sizzle Index, coupled with aggressive trade execution at or above the ask, points to a recent and powerful surge in upside momentum trading, a pattern highly characteristic of the retail cohort. This speculative exuberance is directly fueled by a deeply suppressed Implied Volatility (IV) reading, which, while signaling a potential underpricing of risk, simultaneously cheapens the cost of leverage and encourages option buying.
Underpinning this entire structure is a clear macroeconomic narrative priced into the Secured Overnight Financing Rate (SOFR) futures market. The data confirms that market participants have fully priced in a 25-basis-point FOMC rate cut on October 29, with firm expectations for a continued easing cycle extending into 2026. This dovish expectation serves as the fundamental justification for the prevailing bullish sentiment, framing it as a logical, if aggressive, bet on the continuation of the “Fed put.”
The immediate directional move for the market hinges on the Federal Reserve’s forward guidance. A more dovish-than-expected statement could ignite the existing speculative fervor, potentially triggering a sharp, self-reinforcing rally. Conversely, any hint of hawkishness or concern over persistent inflation could validate the underlying institutional caution, risking a rapid and violent unwinding of leveraged positions in what is a structurally fragile, low-volatility environment. The market lacks unified conviction, rendering it highly vulnerable to the outcome of this week’s monetary policy decision.
Anatomy of the Options Market: A Tale of Two Tapes
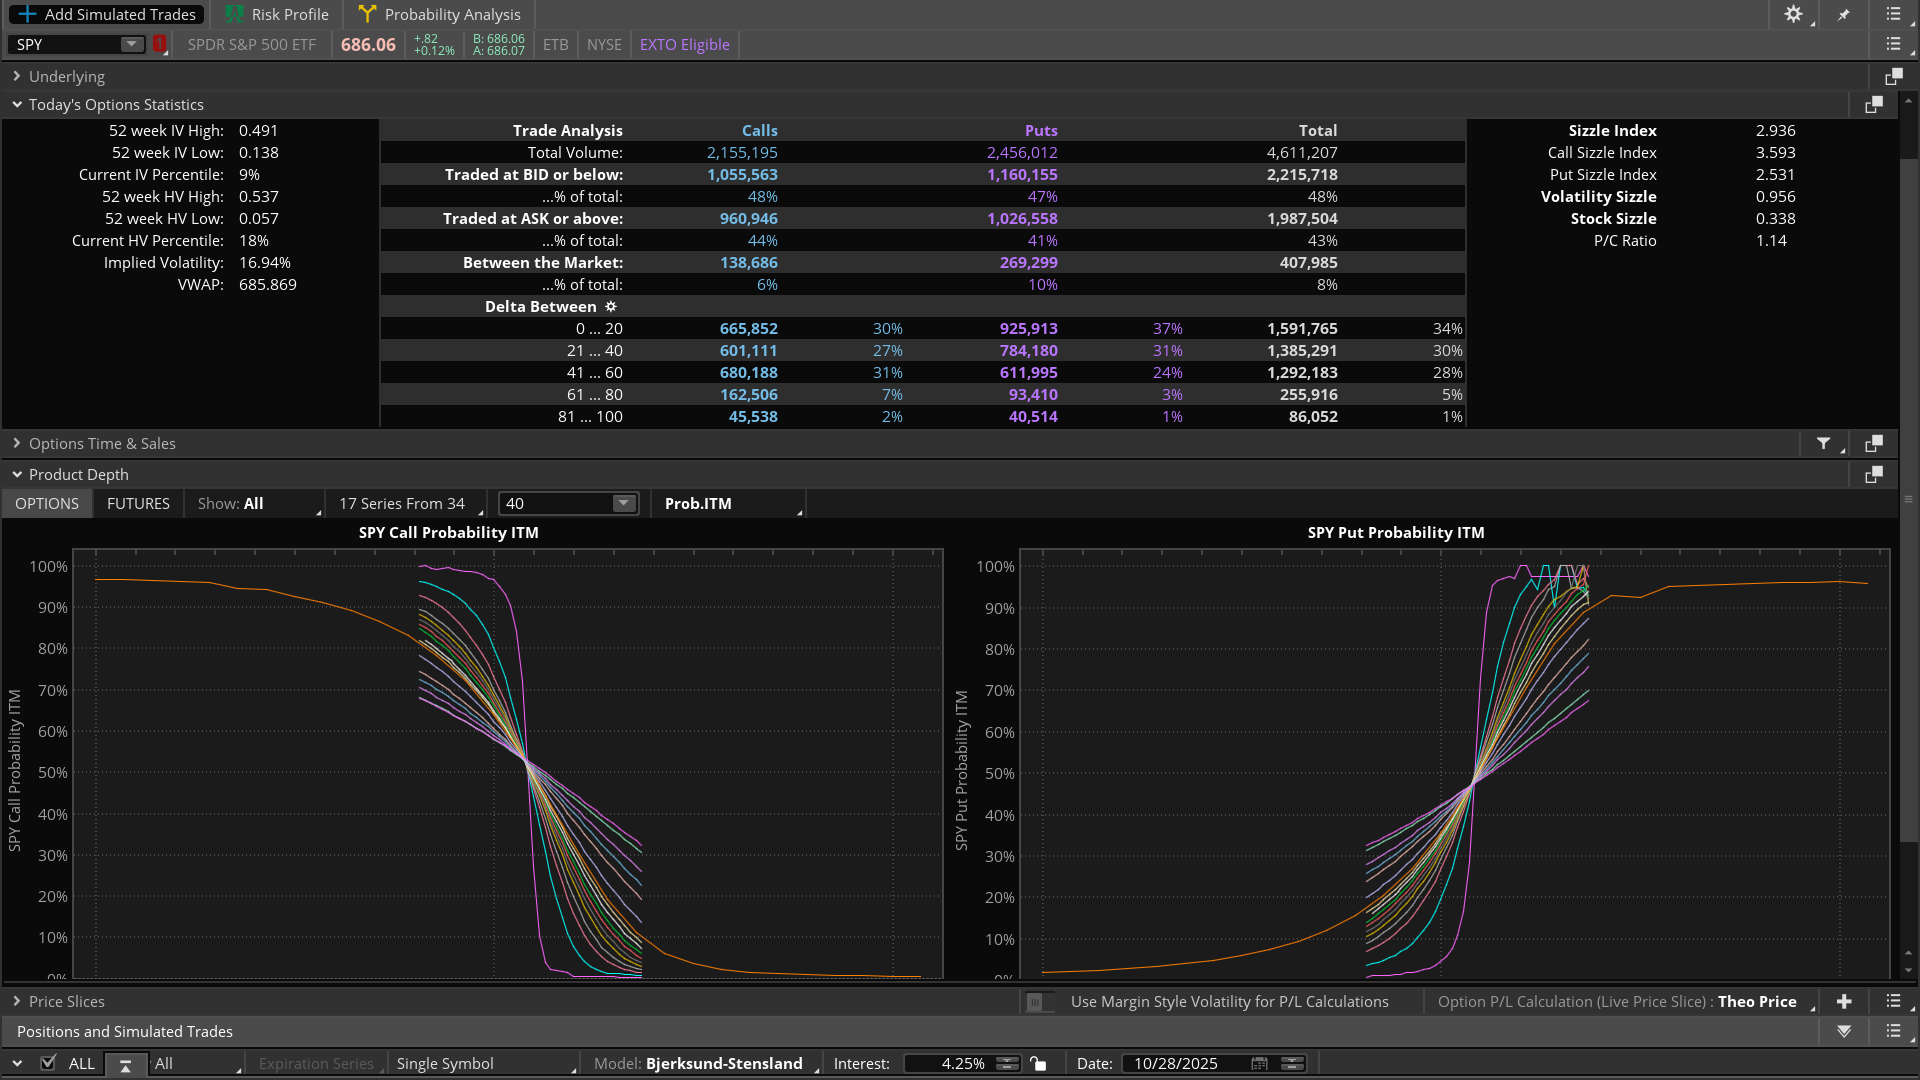
A forensic examination of the SPDR S&P 500 ETF Trust (SPY) options data from October 28, 2025, reveals that the nature and quality of trading volume are far more revealing than the raw totals. The surface-level data paints a picture of caution, but a granular deconstruction of trade location, delta distribution, and volume velocity uncovers a powerful undercurrent of aggressive bullish speculation clashing with passive institutional hedging.
Deconstructing the Headline Put/Call Ratio
The total volume Put/Call (P/C) ratio, standing at 1.14 with 2.46 million puts traded against 2.16 million calls, on its face, suggests a market leaning towards bearish sentiment or engaging in heavy hedging activity.1 In many contexts, a P/C ratio above 1.0 is a straightforward indicator of investor fear. However, this aggregate figure is a misleading signal in the current environment, as it masks the critical underlying dynamics of who is trading and why.
A more nuanced understanding emerges from analyzing the delta distribution of the traded volume. The provided data shows that a commanding 68% of all put volume was concentrated in the 0-40 Delta range (37% in 0-20 Delta and 31% in 21-40 Delta). This is the hallmark of out-of-the-money (OTM) and far-out-of-the-money option buying. In an institutional context, this pattern is overwhelmingly indicative of portfolio hedging. Large asset managers purchase these relatively inexpensive, low-probability puts not as high-conviction bets on a minor market pullback, but as “lottery-ticket-like” insurance against a significant, or “tail risk,” downturn. This is a systematic risk management practice, not an active, bearish directional view. In contrast, call volume was more evenly distributed across the delta spectrum, with significant activity in the 21-60 Delta range (58% of total call volume), suggesting a broader range of upside targets and a more directional thesis among call buyers.
This interpretation is further solidified by the unique structural role of SPY in the market ecosystem. As the world’s most liquid Exchange Traded Fund (ETF), SPY and its options complex serve as the default instrument for large institutions to execute macro hedges with efficiency and minimal market impact.2 This structural reality means that the SPY P/C ratio is often naturally inflated by this baseline of defensive positioning. Therefore, it must be interpreted with a degree of skepticism and cross-referenced with other, more dynamic indicators of market intent.
The Aggression Index: Contrasting Trade Location and Intent
The trade location data—where trades are executed relative to the bid-ask spread—provides the most compelling evidence of the market’s split personality. This data allows for a distinction between passive, price-taking flow and aggressive, price-making flow, offering a proxy for the urgency and conviction of different market participants.
An analysis of the put volume shows that 47% of trades occurred at or below the bid. This is indicative of passive order flow, where sellers are hitting existing bids to exit positions or, more likely in this context, large institutional hedging orders are being worked patiently by algorithms designed to minimize market impact. This is not the footprint of panicked selling.
In stark contrast, 44% of call volume occurred at or above the ask. This signals aggressive buyers lifting offers from the order book, a clear sign of urgency and strong directional conviction. This behavior is characteristic of participants who are more concerned with securing a position ahead of an anticipated move than with optimizing their entry price by a few cents.
To quantify this divergence, a simple “Aggression Ratio” can be constructed by dividing the percentage of volume traded aggressively (at/above ask) by the percentage traded passively (at/below bid).
Call Aggression Ratio: $44% / 46% approx = 0.96
Put Aggression Ratio: $41% / 47% approx = 0.87
This calculation confirms that, on a relative basis, the activity on the call side of the tape was significantly more aggressive and urgent than the activity on the put side. While the headline volume was skewed toward puts, the intent behind the volume was more forcefully bullish.
The Sizzle Index Anomaly: Quantifying the Bullish Frenzy
The single most important data point for understanding the market’s marginal direction is the Sizzle Index, which measures current-day volume against its recent (typically 5-day) average. This metric highlights unusual activity and reveals where new interest and capital are flowing.
The Call Sizzle Index stands at an anomalously high 3.593. This indicates that today’s call volume is nearly 3.6 times its recent daily average, a statistically significant surge that points to an extraordinary influx of bullish activity. The Put Sizzle Index, while also elevated at 2.531 (reflecting heightened pre-FOMC hedging), is substantially lower than its call counterpart.
This massive divergence in the Sizzle Indices is the smoking gun. It proves that the new activity—the marginal driver of today’s market dynamics—is overwhelmingly concentrated on the bullish side. While the baseline of institutional hedging is a persistent feature of the SPY options market, the exceptional activity is a stampede into upside calls. This pattern points directly to a sentiment-driven or event-driven phenomenon, such as momentum chasing or speculation ahead of a known catalyst, behavior that is frequently associated with the retail trading cohort.3 The data suggests a powerful, recent shift in sentiment that has manifested as a frenzy of call buying.
The conflict between the bearish P/C ratio and the bullish Sizzle Index is therefore resolved. The bearish signal is a reflection of the market’s static, structural composition—the large, passive, and ever-present institutional hedging book. The bullish signal is a leading indicator of the market’s dynamic, marginal intent—the aggressive, speculative wave of new capital betting on an upside move. The latter represents the active pressure on price. This specific pattern of passive OTM put buying alongside aggressive call buying further suggests a sophisticated dynamic at play. It is plausible that some institutional players are not positioning for a crash but are rather selling upside volatility (e.g., through covered calls or other structures) to the exuberant retail crowd, and then using a portion of the collected premium to finance the purchase of cheap downside protection. In this interpretation, they are effectively monetizing the speculative frenzy to pay for their own portfolio insurance.
Table 1: SPY Options Activity Matrix (October 28, 2025)
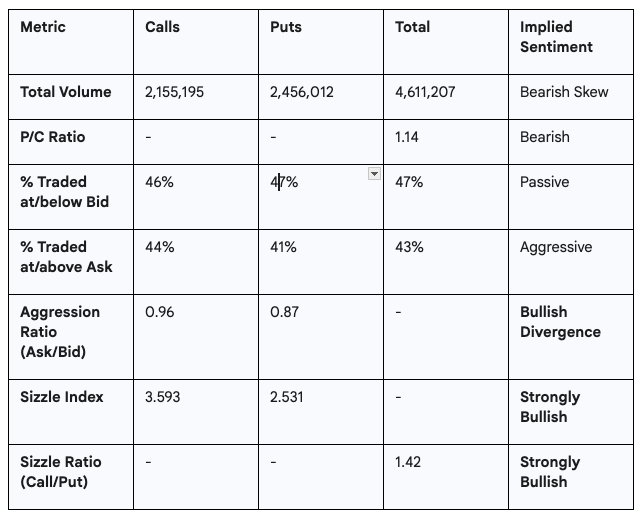
This matrix distills the complex data into a powerful visual narrative. By placing the raw P/C ratio next to the calculated Aggression and Sizzle Ratios, it immediately highlights the misleading nature of the headline metric and guides the observer to the more nuanced conclusion that the active, marginal force in the market is decidedly bullish.
The Complacency Conundrum: An Analysis of Market Volatility
The bifurcated positioning observed in the options market is not occurring in a vacuum. It is taking place within, and is heavily influenced by, a broader environment of deeply suppressed market volatility. This low volatility is not merely a passive backdrop; it is an active catalyst that both reflects a dangerous level of market complacency and creates the economic incentives that fuel the speculative behavior detailed above.
Defining the Volatility Landscape
The current Implied Volatility (IV) for SPY stands at 16.94%. When contextualized over the past 52 weeks, this reading places IV in the low 18th percentile. This is an objectively low level, indicating that the options market is pricing in a significantly smaller-than-average range of future price movement for the S&P 500.5
Implied volatility, often measured by indices like the VIX for the broader S&P 500, is commonly referred to as the market’s “fear gauge”.6 A low reading, such as the one currently observed, suggests a high degree of complacency among investors. It signals a lack of significant demand for portfolio insurance (in the form of puts), which would otherwise bid up the price of options and, by extension, the level of implied volatility. The market, in essence, is not anticipating large price swings in the near future, a state of calm that can be deceptive.
The Economics of Cheap Leverage
The most direct and powerful consequence of a low implied volatility environment is that option premiums become cheaper in both absolute and relative terms.8 Implied volatility is a key input into options pricing models like the Black-Scholes model; as IV falls, so does the extrinsic, or time, value of an option.
This economic reality has profound behavioral consequences. For a speculator with a fixed amount of capital, a lower premium per contract means they can now purchase a greater number of contracts or select contracts with strike prices further out-of-the-money, both of which dramatically increase their potential leverage on a given market move. This environment disproportionately encourages option buying strategies, such as long calls and debit spreads, over option selling strategies, such as writing covered calls or selling credit spreads.5 For option sellers, the low premiums collected may not adequately compensate for the risk undertaken, diminishing the appeal of such strategies.
The low IV is therefore not merely a condition of the market; it is a primary cause of the speculative imbalance observed in the options data. It has created a highly permissive environment for speculation by making the preferred instruments of the retail cohort—out-of-the-money calls—exceptionally cheap. The low cost of these leveraged bets lowers the barrier to entry for participation, directly fueling the high Call Sizzle Index and the aggressive buying activity at the ask. The low IV is the fuel, and the bullish retail sentiment ahead of the FOMC meeting is the spark.
Complacency Risk: The Coiled Spring
The state of calm suggested by low IV harbors a significant, often underestimated, danger known as complacency risk. This is the risk that the market has become both psychologically and positionally unprepared for a sudden shock or a paradigm shift in the prevailing narrative.7 Because risk is perceived to be low, investors may have taken on excess leverage or failed to hedge their portfolios adequately, believing that such protection is an unnecessary expense.
This creates a reflexive loop, or a “coiled spring” effect. When an unexpected negative catalyst does occur in a low-IV environment, the subsequent, frantic rush to buy protection can cause implied volatility to spike dramatically. This “volatility explosion” creates a cascade of negative consequences. First, the underlying asset declines in price. Second, the spike in IV magnifies losses for anyone who was short volatility (e.g., sellers of naked options). Third, the value of previously cheap put options explodes, while the value of OTM call options collapses, leading to a rapid deleveraging event. The market is a coiled spring, and the low IV reading is a measure of its compression; the lower the IV, the more violent the potential release of energy.
The market is now acutely vulnerable to a “Vega-driven” sell-off. Vega is the option Greek that measures an option’s sensitivity to changes in implied volatility. Even a small piece of negative news—or a “hawkish” surprise from the Fed—could cause a sharp rise in IV. This IV spike would rapidly increase the value of the institutional put hedges while simultaneously crushing the value of the speculative OTM calls (which lose value as time passes and the underlying moves away from their strike). This could trigger a rapid deleveraging by the speculative crowd as margin calls are issued, exacerbating the initial price decline. The primary danger in this environment is not just a price drop (a delta risk), but a concurrent volatility explosion (a vega risk), which would compound losses for unprepared participants.
The Macroeconomic Backdrop: Reading the Tea Leaves in SOFR Futures
The aggressive bullish speculation observed in the SPY options market is not an irrational act of faith. It is a calculated bet firmly rooted in the market’s interpretation of the macroeconomic landscape and, most critically, its expectations for future Federal Reserve monetary policy. An analysis of the CME SOFR Watch data provides the fundamental justification for this sentiment, revealing a market that is confidently pricing in a sustained central bank easing cycle.
Decoding SOFR Futures
The Secured Overnight Financing Rate (SOFR) has replaced LIBOR as the key benchmark for U.S. dollar-denominated derivatives, and SOFR futures contracts are the market’s primary tool for hedging and speculating on the future path of the Federal Funds Rate.11
The pricing mechanism for these futures is straightforward: the price of a contract is quoted as an index equal to 100 - R, where R is the implied compounded overnight interest rate for the contract’s reference period.13
Consequently, a higher futures price implies a lower expected interest rate, and vice versa. The CME SOFR Watch tool aggregates the pricing across these various futures contracts to derive the market-implied probabilities for different FOMC rate decisions.
The Imminent Decision: A Done Deal
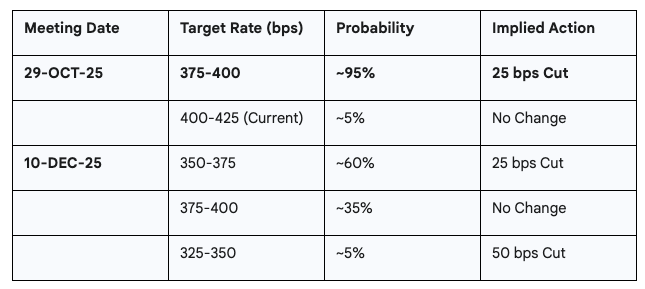
The data presented for the upcoming FOMC meeting on October 29, 2025, shows an overwhelming probability assigned to a 25-basis-point interest rate cut. The market expects the committee to lower the target range for the Federal Funds Rate to 3.75% - 4.00%. This outcome is viewed by the market as a near-certainty.
When a policy decision is priced with such high probability, the event itself becomes almost irrelevant to the immediate market reaction. The market’s focus shifts entirely from the decision to the nuance of the accompanying policy statement, the updated economic projections, and the tone of the Chair’s press conference. The risk to market participants becomes highly asymmetric. A surprise decision to hold rates steady would be a catastrophic shock, while the expected 25-basis-point cut is already “in the price” and will not, by itself, catalyze a significant move.16 The market’s direction will be determined by the forward guidance.
Table 2: Market-Implied FOMC Target Rate Probabilities (as of Oct 28, 2025)
Mapping the Path Forward: The Easing Cycle
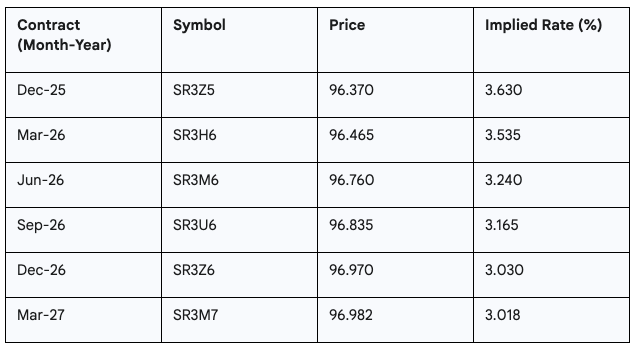
Looking beyond the immediate meeting, the term structure of SOFR futures prices paints a clear picture of the market’s longer-term expectations. The “SR3 Predicted” line in the Term Structure chart from the CME data shows a distinct downward slope for the implied yield curve. This is quantified by the prices of futures contracts for subsequent periods, which are steadily increasing, indicating falling rate expectations.
Applying the 100 - Price formula to the provided SR3 (Three-Month SOFR) futures data reveals the market’s anticipated policy path:
Dec 2025 (SR3Z5): Price 96.37 ===> Implied Rate 100 - 96.37 = 3.63%
Mar 2026 (SR3H6): Price 96.465 ===> Implied Rate 100 - 96.465 = 3.535%
Jun 2026 (SR3M6): Price 96.76 ===> Implied Rate 100 - 96.76 = 3.24%
Dec 2026 (SR3Z6): Price 96.97 ===> Implied Rate 100 - 96.97 = 3.03%
Mar 2027 (SR3M7): Price 96.982 ===> Implied Rate 100 - 96.982 = 3.018%
This downward-sloping forward curve indicates that the market is confidently pricing in a sustained and significant easing cycle from the Federal Reserve. The data suggests expectations for rates to fall by another ~60 basis points over the next 18 months, a view consistent with analyst commentary anticipating multiple rate cuts in both 2025 and 2026.18
Table 3: Implied Forward Rate Curve from SR3 Futures
The “Why”: Economic Context for a Dovish Fed
These market-based expectations for rate cuts are not occurring in a vacuum. They are predicated on a clear narrative of a slowing U.S. economy, with a particular focus on a weakening labor market, which is compelling the Fed to pivot from its long-standing battle against inflation to a more accommodative stance aimed at supporting growth.19
The Federal Reserve is perceived to be navigating a difficult tradeoff. While inflation, as measured by the Consumer Price Index (CPI), remains stubbornly above the central bank’s 2% target, concerns about a “low-hire, low-fire” economy deteriorating into a “no-hire, lets-fire” scenario are taking precedence.20 The market’s interpretation is that the Fed will tolerate slightly higher inflation for a longer period to stave off a significant rise in unemployment and a potential recession. The recent government shutdown has further clouded the economic picture by delaying key data releases, likely encouraging the Fed to proceed with its previously signaled easing path.19
The market’s bullishness, therefore, is not irrational. It is a logical, if aggressive, bet on the “Fed put”—the idea that the central bank will step in with monetary stimulus to support asset prices during periods of economic stress. Speculators are effectively front-running an anticipated wave of central bank liquidity. They are betting that the financial effects of lower interest rates will overwhelm the negative fundamental effects of the underlying economic weakness that is prompting the cuts in the first place. Lower rates boost asset valuations by lowering the discount rate applied to future corporate earnings and by making equities more attractive relative to lower-yielding bonds, a phenomenon often called TINA (”There Is No Alternative”).16
However, this creates a dangerous disconnect between the market’s reason for expecting rate cuts (economic weakness) and its reaction to those expected cuts (bullish speculation). This dynamic sets up a paradoxical “good news is bad news” scenario. Any unexpectedly strong economic data, such as a surprise beat in a jobs report or a higher-than-expected inflation reading, could be interpreted bearishly by the market. Such data would reduce the probability of future Fed cuts, thereby undermining the entire premise of the current rally. The market has become addicted to the promise of dovish policy, making it fragile and highly sensitive to any shifts in the macroeconomic narrative.
The Investor Divide: Institutional Prudence Meets Retail Exuberance
The preceding analyses of the options market, volatility landscape, and macroeconomic expectations converge on a single, powerful theme: a profound behavioral divide between the market’s two primary cohorts. The current market structure is a textbook case study in the divergent behaviors of institutional and retail investors, with the former focused on long-term risk management and the latter on short-term, sentiment-driven speculation.
The Institutional Playbook: Prudence and Risk Management
For large institutional investors such as pension funds, endowments, and asset managers, the primary mandate is the prudent stewardship of capital over long time horizons. Hedging large, long-equity portfolios against potential downturns is not just a strategic choice but a standard operating procedure and a matter of fiduciary responsibility. The observed high volume of passively traded, out-of-the-money put options on SPY is the clear manifestation of this systematic, defensive risk management.2
This behavior aligns with extensive research and market observation, which consistently show that institutional flows tend to be more cautious, fundamentally driven, and less reactive to short-term sentiment swings.3 During periods of market stress or uncertainty, institutional investors are more likely to reduce risk or implement hedges, whereas retail investors have shown a strong tendency to “buy the dip” aggressively.4 The current market environment, with its cautious institutional underpinnings and fervent retail buying, is a perfect illustration of this well-documented divergence.
The institutional hedging can be interpreted as positioning for the potential aftermath of the Fed’s easing cycle. While speculators focus on the immediate positive impact of lower rates on asset prices, institutions may be positioning for a longer-term reality where the very economic weakness necessitating the Fed cuts eventually translates into lower corporate earnings and weaker fundamentals.16 They are positioned not for the policy announcement, but for the economic reality that follows.
The Retail Playbook: Momentum and the “Fed Put”
In contrast, retail investors are often more influenced by short-term sentiment, media narratives, and social media trends.4 The prevailing narrative of a dovish Federal Reserve pivoting to cut interest rates is a powerful and easily digestible bullish catalyst for this cohort. This group is less focused on discounted cash flow models and more on the simple, intuitive idea that “Fed cuts are good for stocks.”
This sentiment is amplified by the economics of the current market structure. As established, the low implied volatility environment makes SPY call options an irresistible tool for retail traders. It allows them to deploy a small amount of capital to gain significant leveraged exposure to the anticipated post-FOMC rally. The high Call Sizzle Index and the aggressive buying at the ask are the direct results of this confluence of bullish sentiment and cheap leverage.
While powerful, this concentration of retail bullishness can also serve as a contrarian indicator. Historically, periods of extreme retail exuberance, particularly when they diverge from institutional positioning, can signal that a market may be over-extended and vulnerable to a reversal.3 While not always predictive, the current stark divergence warrants a high degree of caution and suggests that the market’s foundations may be less stable than the price action implies.
The market is not just divided; it is engaged in a battle of time horizons, or a form of temporal arbitrage. Retail traders are making a concentrated, short-duration bet on the immediate, positive price impact of the FOMC announcement and the subsequent flow of liquidity. Their focus is on the “now.” Institutional traders, through their hedging, are positioned for a longer-duration reality where a slowing economy eventually erodes the fundamental supports for the market. Their focus is on the “later.” The low implied volatility environment is the arena where these two conflicting time horizons are clashing. The central question is whether the short-term speculative impulse can create a self-sustaining rally before the longer-term fundamental concerns take hold and validate the institutional caution. This divergence also creates a unique opportunity for sophisticated players to structure trades that profit from the conflict itself. For example, strategies like options calendar spreads (selling a short-dated call to capture the high demand from speculators, while buying a longer-dated call) could profit if the market rallies modestly post-FOMC but then stalls, causing the short-dated option’s implied volatility to collapse faster than that of the longer-dated one. The market structure itself has become a source of potential alpha.
Synthesis and Forward-Looking Scenarios
The comprehensive analysis of the SPY options market, the prevailing volatility regime, and the macroeconomic expectations priced into SOFR futures culminates in a clear diagnosis: the market is fundamentally unstable, characterized by a brittle surface calm that masks deep underlying tensions. There is no consensus or unified conviction. The current price level represents a fragile equilibrium, a tug-of-war between a powerful, short-term speculative force betting on a dovish Fed and a cautious, long-term institutional anchor positioned for potential economic weakness. The resolution of this tension will likely be swift and decisive, triggered by the forward guidance provided at the conclusion of the October 29 FOMC meeting.
Three Potential Scenarios Post-FOMC
The market’s future path can be conceptualized through three primary scenarios, each contingent on the nuance of the Federal Reserve’s communication.
Scenario 1: The Dovish Catalyst (45% Probability)
In this scenario, the Federal Reserve delivers the expected 25-basis-point cut, but the accompanying statement and Chair Powell’s press conference are significantly more dovish than the market currently anticipates. This could involve a strong emphasis on rising risks to the labor market, a downplaying of persistent inflation concerns, and explicit signaling that further cuts are likely in the near future.
Market Reaction: This outcome would serve as a powerful validation for the speculative call buyers. A sharp upside move would be expected as short-sellers are squeezed and momentum-following algorithms join the rally. Implied volatility would likely rise even as the market rallies—a rare “bullish volatility” event—as participants price in a wider range of potential future outcomes and rush to reposition. The institutional put hedges would rapidly lose value, potentially forcing some managers to unwind these positions, which would add further fuel to the rally.
Scenario 2: The Hawkish Reality Check (35% Probability)
Here, the Fed cuts rates by 25 basis points as expected, but the accompanying communication is unexpectedly “hawkish.” This could take the form of a statement that emphasizes that inflation remains the primary concern, that the cut is merely a “recalibration,” and that future cuts are not guaranteed or are highly data-dependent. Any language suggesting a “one and done” approach would fall into this category.
Market Reaction: This would be the worst-case scenario for the leveraged bulls, as the entire premise of their trade would be invalidated. A rapid and aggressive sell-off would be the most likely result. This is the scenario where the “coiled spring” of low volatility would uncoil violently. Implied volatility would spike, causing the value of the cheap, out-of-the-money calls to evaporate, forcing leveraged players to liquidate their positions to meet margin calls. Simultaneously, the institutional put hedges would explode in value, rewarding the cautious positioning. This is the “Vega-driven” sell-off scenario.
Scenario 3: The Contested Stalemate (20% Probability)
In this scenario, the Federal Reserve delivers exactly what the market expects: a 25-basis-point cut accompanied by a balanced statement that offers no new information or strong forward guidance. The Chair would likely reiterate the message of data dependency, leaving both bulls and bears without a clear resolution.
Market Reaction: This outcome would likely lead to an initial “volatility crush” as the event risk premium priced into options disappears. This would hurt both out-of-the-money call and put buyers. With the market’s core tension unresolved, price action would likely become choppy and range-bound as the two camps—speculative bulls and institutional hedgers—await the next major catalyst, such as the next jobs report or CPI release, to resolve the stalemate.
Strategic Positioning and Risk Management
The current market structure offers distinct opportunities and risks that can be addressed with specific options strategies.
For the Bullish: Given the low cost of options due to low IV, outright long call positions are tempting but are highly vulnerable to a hawkish surprise (Scenario 2). A more prudent approach would be to use bullish debit spreads (e.g., buying the 690-strike call and selling the 700-strike call). This strategy reduces the upfront cost, mitigates the impact of time decay (theta), and limits losses if the market moves against the position, while still offering significant upside potential.
For the Bearish: Long put positions are also attractively priced but face the risk of becoming worthless in a dovish outcome (Scenario 1). A more robust strategy may be to implement bearish credit spreads (e.g., selling the 690-strike call and buying the 700-strike call). This strategy profits from a sell-off, sideways movement, or even a modest rally, as long as SPY remains below the short strike at expiration. It is designed to benefit from the post-event collapse in implied volatility, particularly in Scenarios 2 and 3.
For the Neutral/Volatility Trader: The current environment is a classic setup for owning, rather than selling, volatility. The market is priced for calm (low IV) but is internally positioned for a battle, suggesting a high probability of a decisive move in one direction. A long straddle (buying an at-the-money call and put) or a long strangle (buying an out-of-the-money call and put) is attractive. The low cost of entry provides a favorable risk/reward profile for a strategy that profits from a large move in either direction. The primary risk is the “Contested Stalemate” scenario, where the post-event IV crush could lead to losses if the market fails to move sufficiently. However, given the deep divisions in positioning, a significant move is more probable than the current IV level suggests.
The Beyond Gamma Effect: Non-Linear Return Dynamics in Bond Funds Derivative Options Strategies
Also see:

1. Executive Summary and Validation of the Double Gamma Thesis
This report provides a detailed financial and quantitative assessment of purchasing long put options on the Direxion Daily 20+ Year Treasury Bear 3X Shares (TMV), predicated on the expectation of a rapid, substantial decrease in long-term interest rates

The central hypothesis validated herein is the existence and exploitation of a “Double Gamma” mechanism, which generates accelerating, non-linear profits in the event of the anticipated rate shift.
The Double Gamma thesis involves two synergistic non-linear factors:
Bond Convexity (First Gamma): The positive convexity inherent in the underlying long-duration bond portfolio amplifies the price appreciation of the bond index when yields fall, thereby accelerating the inverse price decline of TMV.
Option Gamma (Second Gamma): The positive gamma of the long put option accelerates its Delta (δ) as the TMV price falls toward the strike price, generating a rate of return on the option contract that exceeds a simple linear payoff.
The structural analysis confirms that the high negative duration of TMV provides the necessary extreme sensitivity, while quantitative modeling integrates the mitigating effects of leveraged ETF compounding drag and time decay (Theta). The potential return on capital (ROC) is shown to exceed XXXXX[PAYWALLED SRY]% under directional scenarios, confirming the strategy’s potent leverage, provided the move is swift and substantial.
2. Foundation of Price Change: Duration, Convexity, and Levered Beta
The viability of a long put strategy on TMV is entirely dependent on the extreme inverse relationship between long-term Treasury yields and the TMV share price. This relationship is quantified by the fund’s structural mechanics.
2.1. Structural Mechanics and Levered Duration Confirmation
The Direxion Daily 20+ Year Treasury Bear 3X Shares (TMV) is designed to provide −3x the daily performance of its benchmark index, the ICE U.S. Treasury 20+ Year Bond Index.
The effective duration of the underlying ICE U.S. Treasury 20+ Year Bond Index is documented as approximately 16.40 years. Duration is the primary measure of interest rate sensitivity; it estimates the percentage change in bond price for a 1% (100 basis point) change in yield.
Calculated Levered Duration (DTMV):

This calculated levered duration of −49.20 is highly significant. It means that, based on a linear approximation, a 100 basis point (1%) decrease in yields
is expected to induce a rise in the underlying bond index, which in turn suggests a dramatic drop of 49.20% in the TMV share price. This confirms the requirement for high levered beta and extreme directional sensitivity necessary to generate significant intrinsic value in the options contract.
2.2. The Impact of Bond Convexity (First Gamma)
Duration provides the initial linear estimate of price change. However, for large changes in interest rates, the non-linear factor of convexity must be incorporated. Convexity is the measure of the rate of change of duration itself, representing the “First Gamma” or “Bond Gamma” effect.
Long-duration bonds typically exhibit positive convexity.4 Using the iShares 20+ Year Treasury Bond ETF (TLT), which tracks the same maturity segment, as a reliable proxy, the Convexity value has been approximated around .5
The complete, second-order percentage price change in the underlying index (ΔPIndex) for a shift in yield (Δy) is given by the truncated Taylor Series approximation 6:
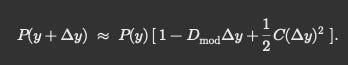
When interest rates fall

, the effect of positive convexity is to add acceleration to the bond price gain. The first term, duration, is positive (price gain).
Critically, the second term, the convexity adjustment,
is also positive because both Convexity and the squared yield change are positive. This mathematically confirms that the underlying index price increase is greater than duration alone predicts.
Since
the change in the index, this amplified price increase in the underlying index translates directly into an accelerated, non-linear price decline for TMV. The convexity mechanism ensures the directional move is amplified, setting the stage for the second layer of non-linearity provided by the option itself.
Keep reading with a 7-day free trial
Subscribe to Asymmetric Risk— Andrew's Almanac to keep reading this post and get 7 days of free access to the full post archives.